Code
library(tidyverse)library(tidyverse)“Lecture on Economics” in Nikkei news paper on May 3 to 5, 2021 was titled “Think about the burden for future generations.” Lectures are here, here and here (Japanese, subscription required). The authors think that lack of government morale causes government debt. They think politicians are not well disciplined, and are weak under the pressure from spend-demanding and tax-averse electorate.
So the first proposes a debt rollover restriction rule, to which I have strong objection. Don’t forget the U.S. debt ceiling crisis under the Obama administration and the Republican controlled House. The second proposes independent fiscal institutions, of which effectiveness I doubt. The third proposes Covid-19 measures should be financed by taxes, not by deficits, because deficits divert resources from productive capital accumulation. He may be right, if the deficits crowd out investment by causing higher interest rates. But now I observe persistent zero interest rates, and no crowding-out.
So I don’t think government debt is a morale issue.
Nikkei title is “Think about the burden for future generations.” Is government debt a burden for future generations in the first place?
Paul Krugman says no. “Debt is Money We Owe to Ourselves.” (here) Dean Baker says no. “There is a distributional issue — Bill Gates’ children may own all the debt — but that is within generations, not between generations.” (here)
Simon Wren-Lewis says yes, if we consider overlapping generations. “Government debt can be a burden on future generations.” (here)
Which side is right? I think both sides are right. According to Oxford Languages via Google, “generation” meanings are:
the average period, generally considered to be about thirty years, in which children grow up, become adults, and have children of their own.
all of the people born and living at about the same time, regarded collectively.
Paul Krugman and Dean Baker are right if they use “generation” as 1, and Simon Wren-Lewis is right if he uses “generation” as 2.
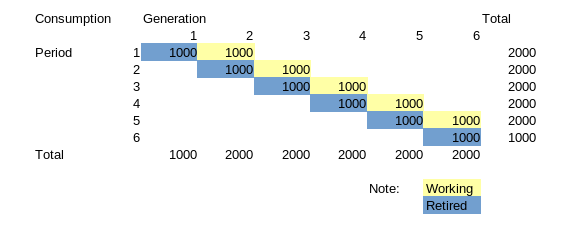
Let us call 1 as “Period” and 2 as “Generation,” then I can show Generation overlap as below. Every Generation lives in 2 Periods. For example, Generation 2 lives working in Period 1 and lives retired in Period 2.
To clarify my understanding, I make a tiny model to replicate above table. You can see my tiny model at tiny_model function in the Rmarkdown format of this post.
Imagine a one factor (labor), three sector (Generation 1 and 2, Government), and closed economy. There is no capital, no business sector, no international trade, and no foreigner. Ignore financial sector as an intermediary. And imagine all goods and services produced in a Period are perishable, and must be consumed in that Period, like foodstuff and entertainment, care and medicine services. There is no stock, and no investment. And imagine the only role of Government is to issue and pay back bonds, of which duration is one Period, 30 years. There is no defense spending, and no taxes. The only method for Generation to save is to buy bonds.
In Period 1, Generation 1 and Generation 2 lives, but only Generation 2 works. If the population in Generation 2 is 100 persons, and the productivity in Period 1 is 20 yen per person, 2000 yen worth goods and services are produced.
tiny_model <- function(population_growth, productivity_growth, saving_rate = NULL) {
  by_generation <- tibble(
    Generation = 1:7,
    population = 100 * c(1, cumprod(population_growth)),
    reproduce_rate = c(population_growth, NA)
  )

  by_period <- tibble(
    Period = 1:6,
    pop_retired = by_generation$population[-7],
    pop_working = by_generation$population[-1],
    productivity = 20 * c(1, cumprod(productivity_growth))
  )

  by_period <- by_period %>%
    mutate(
      pop_total = pop_retired + pop_working,
      retired_ratio_pop = pop_retired / pop_total,
      GDP = productivity * pop_working
    )

  if (is.null(saving_rate)) {
    saving_rate <- by_period$retired_ratio_pop
  }

  by_period <- by_period %>%
    mutate(
      consump_working = GDP * (1 - saving_rate),
      consump_retired = GDP - consump_working,
      percap_cons_wk = consump_working / pop_working,
      percap_cons_re = consump_retired / pop_retired,
      # real interest rate per year
      annual_interest_rate = ((consump_retired / lag(consump_retired))^(1/30) - 1) * 100,
      debt_GDP_ratio = consump_retired / GDP
    )

  by_generation <- by_generation %>%
    bind_cols(
      tibble(
          consump_working = c(NA, by_period$consump_working[-11]),
          consump_retired = c(by_period$consump_retired, NA)
      )
    )

  by_generation <- by_generation %>%
    mutate(
      consumption = consump_working + consump_retired,
      income_from_work = c(NA, by_period$GDP),
      income_from_interest = consumption - income_from_work,
      percap_consump = consumption / population,
      percap_income_from_work = income_from_work / population,
      percap_income_from_interest = income_from_interest / population,
      percap_cons_wk = c(NA, by_period$percap_cons_wk),
      percap_cons_re = percap_consump - percap_cons_wk
      )

  list(
    by_period = by_period,
    by_generation = by_generation
  )
}
From Period 2 and on, let us assume population by Generation is constant 100 persons, population by Period is constant 200 persons, and productivity is constant 20 yen per person. And let us assume working Generation and retired Generation in each Period agree to share the produced so that each person can consume equally. As each working Generation consume half of what they produce, the saving rate is 0.5.
# multiplier by Generation, 30 years, is constant 1 for Generation 2 to 7
population_growth <- rep(1, 6)

# multiplier by Period, 30 years, is constant 1 for Period 2 to 6
productivity_growth <- rep(1, 5)

model1 <- tiny_model(population_growth, productivity_growth)

model1$by_period %>%
  select(Period, pop_total, pop_retired, pop_working, retired_ratio_pop) %>%
  knitr::kable(
    col.names = c(
      "Period",
      "Population Total (persons)",
      "Population Retired (persons)",
      "Population Working (persons)",
      "Ratio of Retired"
      )
)| Period | Population Total (persons) | Population Retired (persons) | Population Working (persons) | Ratio of Retired |
|---|---|---|---|---|
| 1 | 200 | 100 | 100 | 0.5 |
| 2 | 200 | 100 | 100 | 0.5 |
| 3 | 200 | 100 | 100 | 0.5 |
| 4 | 200 | 100 | 100 | 0.5 |
| 5 | 200 | 100 | 100 | 0.5 |
| 6 | 200 | 100 | 100 | 0.5 |
model1$by_period %>%
  select(Period, productivity, percap_cons_wk, percap_cons_re) %>%
  knitr::kable(
    col.names = c(
      "Period", "Productivity (yen/person)",
      "Consumption by Working (yen/person)",
      "Consumption by Retired (yen/person)"
    )
)| Period | Productivity (yen/person) | Consumption by Working (yen/person) | Consumption by Retired (yen/person) |
|---|---|---|---|
| 1 | 20 | 10 | 10 |
| 2 | 20 | 10 | 10 |
| 3 | 20 | 10 | 10 |
| 4 | 20 | 10 | 10 |
| 5 | 20 | 10 | 10 |
| 6 | 20 | 10 | 10 |
model1$by_period %>%
  select(Period, GDP:consump_retired, debt_GDP_ratio) %>%
  knitr::kable(
    col.names = c(
      "Period", "GDP (yen)",
      "Consumption by Working (yen)",
      "Consumption by Retired (yen)",
      "Government debt to GDP ratio = Saving rate"
      )
)| Period | GDP (yen) | Consumption by Working (yen) | Consumption by Retired (yen) | Government debt to GDP ratio = Saving rate |
|---|---|---|---|---|
| 1 | 2000 | 1000 | 1000 | 0.5 |
| 2 | 2000 | 1000 | 1000 | 0.5 |
| 3 | 2000 | 1000 | 1000 | 0.5 |
| 4 | 2000 | 1000 | 1000 | 0.5 |
| 5 | 2000 | 1000 | 1000 | 0.5 |
| 6 | 2000 | 1000 | 1000 | 0.5 |
Each Generation n produces 20 yen per person in Period n-1 , and consumes 10 yen in Period n-1 and 10 yen in Period n, 20 yen in total. Note that every yen value is in real, denoted in Period 1 price level yen.
model1$by_generation %>%
  select(Generation, population, percap_consump, percap_cons_wk, percap_cons_re) %>%
  knitr::kable(
    col.names = c(
      "Generation", "Population (persons)",
      "Consumption in Total (yen/person)",
      "Consumption in Working (yen/person)",
      "Consumption in Retired (yen/person)"
    )
)| Generation | Population (persons) | Consumption in Total (yen/person) | Consumption in Working (yen/person) | Consumption in Retired (yen/person) |
|---|---|---|---|---|
| 1 | 100 | NA | NA | NA |
| 2 | 100 | 20 | 10 | 10 |
| 3 | 100 | 20 | 10 | 10 |
| 4 | 100 | 20 | 10 | 10 |
| 5 | 100 | 20 | 10 | 10 |
| 6 | 100 | 20 | 10 | 10 |
| 7 | 100 | NA | 10 | NA |
Now imagine, in Period 2, Generation 2 and 3 agree to change sharing ratio from 50:50 to 60:40 by Generation 3 buying additional bonds and Government giving the received money to Generation 2. Generation 3’s saving rate changes from 0.5 to 0.6. Generation 3 may have been persuaded, as consumption in life will be unchanged 20 yen per person if the same custom continues, that is Generation 4 will save 0.6 in Period 3. Generation 2 can benefit from this deal, as they can consume 22 yen per person more than 20 yen they produce in life.
And imagine, in Period 5, Generation 5 and 6 agree to abolish this custom for some reason. Generation 5 can consume only 18 yen per person in life. Consumption of 2 yen per person is transferred to Generation 2 from Generation 5, a future generation.
# 0.5 in Period 1, 0.6 in Period 2 to 4, and 0.5 in Period 5 to 6
saving_rate <- c(0.5, rep(0.6, 3), rep(0.5, 2)) # multiplier by Generation, 30 years, is constant 1 for Generation 2 to 7
population_growth <- rep(1, 6)
# multiplier by Period, 30 years, is constant 1 for Period 2 to 6
productivity_growth <- rep(1, 5)
model2 <- tiny_model(population_growth, productivity_growth, saving_rate)model2$by_period %>%
select(Period, GDP:consump_retired, debt_GDP_ratio) %>%
knitr::kable(
col.names = c(
"Period", "GDP (yen)",
"Consumption by Working (yen)",
"Consumption by Retired (yen)",
"Government debt to GDP ratio = Saving rate"
)
)| Period | GDP (yen) | Consumption by Working (yen) | Consumption by Retired (yen) | Government debt to GDP ratio = Saving rate |
|---|---|---|---|---|
| 1 | 2000 | 1000 | 1000 | 0.5 |
| 2 | 2000 | 800 | 1200 | 0.6 |
| 3 | 2000 | 800 | 1200 | 0.6 |
| 4 | 2000 | 800 | 1200 | 0.6 |
| 5 | 2000 | 1000 | 1000 | 0.5 |
| 6 | 2000 | 1000 | 1000 | 0.5 |
model2$by_generation %>%
  select(Generation, population, percap_consump, percap_cons_wk, percap_cons_re) %>%
  knitr::kable(
    col.names = c(
      "Generation", "Population (persons)",
      "Consumption in Total (yen/person)",
      "Consumption in Working (yen/person)",
      "Consumption in Retired (yen/person)"
    )
)| Generation | Population (persons) | Consumption in Total (yen/person) | Consumption in Working (yen/person) | Consumption in Retired (yen/person) |
|---|---|---|---|---|
| 1 | 100 | NA | NA | NA |
| 2 | 100 | 22 | 10 | 12 |
| 3 | 100 | 20 | 8 | 12 |
| 4 | 100 | 20 | 8 | 12 |
| 5 | 100 | 18 | 8 | 10 |
| 6 | 100 | 20 | 10 | 10 |
| 7 | 100 | NA | 10 | NA |
But is this Generation 5 worse-off caused by the burden of government debt on future Generations?
Now, suppose Government suddenly discovers a new way to transfer buying power across Generation other than issuing additional bonds. The new way is tax and transfer payment, like pay-go based pension system. You may cry foul, claiming this should also be counted as government debt, though this is not bond balance. You may be right in accounting, but you can feel the difference between government debt and government promise in pension system is not solid but fluid.
From this thought experiment, I would like to say the burden on future Generations is not government debt per se, but legacy social contract on how to share. Social contract made between Generation 2 and 3 becomes a legacy. Because of this legacy, Generation 3 and 4 in Period 4, and Generation 4 and 5 in Period 5 agree to share 60:40. But Generation 5 and 6 fail to keep this legacy in Period 6. This legacy turns out to be the burden on Generation 5. Generation 6 is now free from this burdensome legacy.
In above simulation, Generation 2 is better off and Generation 5 is worse off. Is this kind of situation rare? No. If we assume population increases and decreases, there happens population bonus and onus.
Below is a rough image of population changes in Japan. Generation 1 works in Period 0: 1880-1910, and Generation 7 works in Period 6: 2060-2090. In Period 4: 2000-2030, Generation 4 is retired and Generation 5 is working. Although I am in the middle of Generation 4 and 5 in reality, let us read below as if we are Generation 5.
I assume no productivity growth. And I assume Generation n and Generation n-1 agree to share the produced by population ratio so that each person can consume equally in each Period. So government debt to GDP ratio, which is the same as the saving rate and the ratio of consumption by the retired to total consumption by definition in this model, is exactly same as population ratio of the retired in each Period.
# multiplier by Generation, 30 years, is:
# 1.3 for Generation 2 to 4, 0.8 for Generation 5, 0.65 for Generation 6 to 7
population_growth <- c(rep(1.3, 3), 0.8, rep(0.65, 2))

# multiplier by Period, 30 years, is constant 1 for Period 2 to 6
productivity_growth <- rep(1, 5)

model3 <- tiny_model(population_growth, productivity_growth)model3$by_generation %>%
select(Generation, population, reproduce_rate) %>%
knitr::kable(
col.names = c(
"Generation", "Population (persons)",
"Reproduce rate"
),
digits = c(rep(0, 2), 2)
)| Generation | Population (persons) | Reproduce rate |
|---|---|---|
| 1 | 100 | 1.30 |
| 2 | 130 | 1.30 |
| 3 | 169 | 1.30 |
| 4 | 220 | 0.80 |
| 5 | 176 | 0.65 |
| 6 | 114 | 0.65 |
| 7 | 74 | NA |
model3$by_period %>%
  select(Period, pop_total, pop_retired, pop_working, retired_ratio_pop) %>%
  knitr::kable(
    col.names = c(
      "Period",
      "Population Total (persons)",
      "Population Retired (persons)",
      "Population Working (persons)",
      "Ratio of Retired"
      ),
    digits = c(rep(0, 4), 2)
)| Period | Population Total (persons) | Population Retired (persons) | Population Working (persons) | Ratio of Retired |
|---|---|---|---|---|
| 1 | 230 | 100 | 130 | 0.43 |
| 2 | 299 | 130 | 169 | 0.43 |
| 3 | 389 | 169 | 220 | 0.43 |
| 4 | 395 | 220 | 176 | 0.56 |
| 5 | 290 | 176 | 114 | 0.61 |
| 6 | 189 | 114 | 74 | 0.61 |
model3$by_period %>%
  select(Period, GDP:consump_retired, debt_GDP_ratio, annual_interest_rate) %>%
  knitr::kable(
    col.names = c(
      "Period", "GDP (yen)",
      "Consumption by Working (yen)",
      "Consumption by Retired (yen)",
      "Government debt to GDP ratio = Saving rate",
      "Interest rate (percent)"
      ),
    digits = c(rep(0, 4), rep(2, 2))
)| Period | GDP (yen) | Consumption by Working (yen) | Consumption by Retired (yen) | Government debt to GDP ratio = Saving rate | Interest rate (percent) |
|---|---|---|---|---|---|
| 1 | 2600 | 1470 | 1130 | 0.43 | NA |
| 2 | 3380 | 1910 | 1470 | 0.43 | 0.88 |
| 3 | 4394 | 2484 | 1910 | 0.43 | 0.88 |
| 4 | 3515 | 1562 | 1953 | 0.56 | 0.07 |
| 5 | 2285 | 900 | 1385 | 0.61 | -1.14 |
| 6 | 1485 | 585 | 900 | 0.61 | -1.43 |
Generation 2 worked in Period 1 and saved 1130 yen, and can consume 1470 yen in Period 2. How come? We can interpret this as Generation 2 earned interest income from saving, and the interest rate of bonds is 0.88 percent annually.
Generation 5 saved 1953 yen in Period 4, but can consume only 1385 in Period 5. We can interpret this as Generation 5 earned negative interest rate, -1.14 percent, in Period 5.
As the yen value is denoted in real terms, at Period 1 price level, interest rate is real interest rate. In this model, safe real interest rate is endogenous. Positive interest rate is a bonus, and negative one is an onus from population changes.
model3$by_generation %>%
  select(Generation, population, percap_consump, percap_cons_wk, percap_cons_re) %>%
  knitr::kable(
    col.names = c(
      "Generation", "Population (persons)",
      "Consumption in Total (yen/person)",
      "Consumption in Working (yen/person)",
      "Consumption in Retired (yen/person)"
    ),
    digits = c(rep(0, 2), rep(1, 3))
)| Generation | Population (persons) | Consumption in Total (yen/person) | Consumption in Working (yen/person) | Consumption in Retired (yen/person) |
|---|---|---|---|---|
| 1 | 100 | NA | NA | NA |
| 2 | 130 | 22.6 | 11.3 | 11.3 |
| 3 | 169 | 22.6 | 11.3 | 11.3 |
| 4 | 220 | 20.2 | 11.3 | 8.9 |
| 5 | 176 | 16.8 | 8.9 | 7.9 |
| 6 | 114 | 15.8 | 7.9 | 7.9 |
| 7 | 74 | NA | 7.9 | NA |
Each Generation produces 20 yen per person. Generation 2 and 3 consumes more than 20 yen, Generation 4 consumes approximately 20 yen, and Generation 5 and 6 consumes less than 20 yen.
model3$by_generation %>%
  select(Generation, percap_consump, percap_income_from_work, percap_income_from_interest) %>%
  knitr::kable(
    col.names = c(
      "Generation", "Consumption in Total (yen/person)",
      "Income in Working (yen/person)",
      "Income in Retired (interest income) (yen/person)"
    ),
    digits = c(0, rep(1, 3))

)| Generation | Consumption in Total (yen/person) | Income in Working (yen/person) | Income in Retired (interest income) (yen/person) |
|---|---|---|---|
| 1 | NA | NA | NA |
| 2 | 22.6 | 20 | 2.6 |
| 3 | 22.6 | 20 | 2.6 |
| 4 | 20.2 | 20 | 0.2 |
| 5 | 16.8 | 20 | -3.2 |
| 6 | 15.8 | 20 | -4.2 |
| 7 | NA | 20 | NA |
We, Generation 5, can consume 16.8 yen per person, less than 20 yen we produce. Why is interest income from holding bonds negative? Isn’t this unfair? In theory, this is because we chose to have fewer children, Generation 6, who produce and share in Period 5. But as we, Generation 5, outnumber Generation 6, we may fight politically and get larger share in Period 5. This is so called “Silver Democracy.” If we do so, government debt to GDP ratio jumps from current 0.61. And this social contract on how to share may become the burdensome legacy for future Generations.
# Reproduce rate over Generation, 30 years:
population_growth <- c(rep(1.3, 3), 0.8, rep(0.65, 2))

# Annual growth rates in percent from Period 2 to 6
prod_gr_annual <- c(2, 8, 1, 0, 0)

productivity_growth <- ((prod_gr_annual + 100) / 100) ^ 30
Next, I change the assumption of productivity from constant to growing by annual rate of 2, 8, 1, 0, 0 percent in Period 2 to 6 respectively.
I assume Generation n and Generation n-1 agree to share the produced by population ratio so that each person can consume equally in each Period. No “Silver Democracy.”
model4 <- tiny_model(population_growth, productivity_growth)

model4$by_period %>%
  select(Period, productivity, percap_cons_wk, percap_cons_re) %>%
  knitr::kable(
    col.names = c(
      "Period", "Productivity (yen/person)",
      "Consumption by Working (yen/person)",
      "Consumption by Retired (yen/person)"
    ),
    digits = c(rep(0, 4))
)| Period | Productivity (yen/person) | Consumption by Working (yen/person) | Consumption by Retired (yen/person) |
|---|---|---|---|
| 1 | 20 | 11 | 11 |
| 2 | 36 | 20 | 20 |
| 3 | 365 | 206 | 206 |
| 4 | 491 | 218 | 218 |
| 5 | 491 | 194 | 194 |
| 6 | 491 | 194 | 194 |
model4$by_period %>%
  select(Period, GDP:consump_retired, debt_GDP_ratio, annual_interest_rate) %>%
  knitr::kable(
    col.names = c(
      "Period", "GDP (yen)",
      "Consumption by Working (yen)",
      "Consumption by Retired (yen)",
      "Government debt to GDP ratio = Saving rate",
      "Interest rate (percent)"
      ),
    digits = c(rep(0, 4), rep(2, 2))
)| Period | GDP (yen) | Consumption by Working (yen) | Consumption by Retired (yen) | Government debt to GDP ratio = Saving rate | Interest rate (percent) |
|---|---|---|---|---|---|
| 1 | 2600 | 1470 | 1130 | 0.43 | NA |
| 2 | 6122 | 3460 | 2662 | 0.43 | 2.90 |
| 3 | 80090 | 45268 | 34822 | 0.43 | 8.95 |
| 4 | 86359 | 38382 | 47977 | 0.56 | 1.07 |
| 5 | 56134 | 22113 | 34020 | 0.61 | -1.14 |
| 6 | 36487 | 14374 | 22113 | 0.61 | -1.43 |
model4$by_generation %>%
  select(Generation, population, percap_consump, percap_cons_wk, percap_cons_re) %>%
  knitr::kable(
    col.names = c(
      "Generation", "Population (persons)",
      "Consumption in Total (yen/person)",
      "Consumption in Working (yen/person)",
      "Consumption in Retired (yen/person)"
    ),
    digits = c(rep(0, 5))
)| Generation | Population (persons) | Consumption in Total (yen/person) | Consumption in Working (yen/person) | Consumption in Retired (yen/person) |
|---|---|---|---|---|
| 1 | 100 | NA | NA | NA |
| 2 | 130 | 32 | 11 | 20 |
| 3 | 169 | 227 | 20 | 206 |
| 4 | 220 | 424 | 206 | 218 |
| 5 | 176 | 412 | 218 | 194 |
| 6 | 114 | 387 | 194 | 194 |
| 7 | 74 | NA | 194 | NA |
model4$by_generation %>%
  select(Generation, percap_consump, percap_income_from_work, percap_income_from_interest) %>%
  knitr::kable(
    col.names = c(
      "Generation", "Consumption in Total (yen/person)",
      "Income in Working (yen/person)",
      "Income in Retired (interest income) (yen/person)"
    ),
    digits = c(rep(0, 4))

)| Generation | Consumption in Total (yen/person) | Income in Working (yen/person) | Income in Retired (interest income) (yen/person) |
|---|---|---|---|
| 1 | NA | NA | NA |
| 2 | 32 | 20 | 12 |
| 3 | 227 | 36 | 190 |
| 4 | 424 | 365 | 60 |
| 5 | 412 | 491 | -79 |
| 6 | 387 | 491 | -104 |
| 7 | NA | 491 | NA |
Shocking result for us, Generation 5! We consume 412 yen per person, which is less than 491 yen we produce, and less than 424 yen Generation 4 consumes. Generation 5 is the first generation to become poorer than preceding Generation.
This happens because I assume that productivity growth is zero in Period 5 when Generation 6 works, and that population reproduce rate by Generation 5 is less than 1.
Interest rate in Period 5, 2030-2060, is negative, -1.14 percent. That is the return by holding bonds for Generation 5 who live retired in Period 5. How can we get negative interest rate? The answer is inflation. Nominal interest rate can’t be much negative as long as paper money remains as an alternative way of saving. But real interest rate can be negative with inflation.
This simulation suggests that it is possible for Bank of Japan to achieve 2 percent inflation target before long, as interest rate in Period 5 can be interpreted as a return rate we get by buying bonds in 2015 and selling in 2045 on average. Inflation is 2 percent, nominal interest rate is 0.86, and real interest rate is -1.14 on average from 2015 to 2045.
Of course, this is a simulation, not a prediction. But I can say that aging and decreasing population and stagnant productivity growth leads to inflation eventually in this model. Is this model, which assumes one factor no business sector closed economy, too unrealistic? In reality, there is business and foreign sector, investment, international trade and wage negotiation. Aging and decreasing population prompts businesses to reduce investment. Stagnant productivity growth prompts businesses to be tough in wage negotiations. Balassa-Samuelson effect works in reverse. Does aging and decreasing population and stagnant productivity growth lead to deflation, instead of inflation, in reality?
I am not sure whether I can and should expand this model by adding factors and sectors to make it closer to reality. So I would like to propose my thinking as a hypothesis. I think there exists multi-equilibrium on inflation. Although prospect for Generation 6 population is close to certain, prospect for productivity growth is still uncertain. We are often told we will be replaced by AI in the work place. If it is true, it will be a huge jump in productivity. Abundant production capacity can satisfy all the demands. As long as we believe so, there is no inflation pressure. This is the first equilibrium. But if productivity growth statistics continues to show otherwise and to disappoint us, we Generation 5 will someday accept the idea that we can’t consume as much as we saved, and that we must be poorer than Generation 4. On that day, we rush to consume by trying to get more share of consumption from each other in Generation 5 and/or from Generation 6. As buying power exceeds production capacity, inflation pressure mounts, and inflation will come. This is the second equilibrium. I am not hinting at hyper-inflation. Modest inflation is enough.
Thank you for reading a long thought experiment.